





Installing a fall management system is the easy part. Proving it works is harder, and it is what administrators, surveyors and families will ask about.
A working system gets help to a resident fast, catches falls staff could otherwise miss, and doesn’t bury caregivers in false alarms.
The stakes are high: the CDC reports nearly 3 million emergency department visits for older adult falls in 2021, and about one in four adults aged 65 and older falls each year.
Here are six things to measure, followed by a scorecard to track them.
1. Response Time
Measure three intervals: alarm to alert received, alert received to acknowledgment, and acknowledgment to a caregiver at the resident’s side.
Consider reporting the average and the 90th percentile, broken out by shift. A three-minute average can hide an 11-minute 90th percentile on night shift.
RF Technologies reports that facilities with a fall detection system respond about 30 minutes faster on average than facilities without one. Treat that as a benchmark, not a substitute for your own numbers, and pull timestamps from the system’s event log rather than from staff recollection.
2. Detection Coverage and False Alarms
Most programs combine three layers, each covering a different gap:
• Pads for beds, chairs, toilets and floors. Bed pads and chair pads alert when an at-risk resident leaves a position, and cordless versions can connect to nurse call.
• Wearable pendants with automatic fall detection. They alert even when a resident cannot press a button.
• Fixed wall-mounted radar sensors. They monitor a room without a camera and keep working in low light, steam and humidity, which matters in bathrooms.
RFT’s Sensatec® pads, Quick Response® pendants and Chirp sensor cover these three layers. Whatever you use, test each layer where it will be used: bathrooms, hallways, dining areas and common rooms, not just the bedside. Then track:
• Share of falls detected automatically versus found by a staff member
• Alarms per resident per day, and the percentage with no fall behind them
• Repeat nuisance alarms from one room or resident, which usually point to placement or battery problems
Treat any vendor claim about fewer false alarms as something to verify against your own alarm log.
3. Fall and Injury Outcomes
Use rates instead of raw counts so census changes do not distort the picture:
• Falls and falls with injury per 1,000 resident days
• Repeat falls among residents who have already fallen
• Falls by time of day, location and shift
One caution on timing. Effective October 1, 2025, CMS changed how falls are classified in the MDS 3.0 Resident Assessment Instrument User’s Manual, adding falls caused by external forces such as being pushed, and expanding the list of major injuries. Here is a breakdown of how the new fall reporting requirements affect quality scores and penalties. If your baseline period falls before that date, your numbers may rise on paper with no real decline in care, so compare like with like.
Falls are infrequent in any single community, so compare at least two quarters before and after, and note staffing, census and acuity changes in the same window.
4. Documentation and Staff Adoption
A drop in reported falls does not mean fewer falls, because not every fall is reported. Compare system alerts against incident reports:
• Alarms with no matching incident report, and reported falls with no matching alarm
• Time between a fall and its documentation
• Share of at-risk residents with the right device in use on each shift
• Pad and sensor check completion, training completion and pendant wear rates
A mismatch is not an accusation. It is a lead pointing to a training, coverage or workflow gap. Ask aides whether they trust the alarms, and ask residents and families whether the system respects dignity.
5. Prevention, Not Just Detection
Detection tells you a fall happened. Prevention uses the data to stop the next one: which residents get up repeatedly at night, which rooms generate near-miss alarms, and whether a care plan change after one fall actually reduced the next. Some radar sensors also log room occupancy, time in bed and time spent walking.
The strongest programs pair the technology with a dedicated Safe Patient Handling and Mobility (SPHM) coordinator who reviews the data. This guide to mitigating fall liability costs explains why, and selecting the right fall management solution helps match devices to your residents.
6. The Financial Case
Build your own baseline: annual fall cost = injurious falls x average cost per injurious fall + liability and legal costs + staff time and overtime. Then compare it with the full program cost, including devices, batteries, service and training.
RF Technologies’ calculator assumes a fall rate of 1 in 4 residents, an injury rate of 1 in 10 of those, an average cost of $62,521 per fall, and a 22% relative risk reduction drawn from a JAMDA meta-analysis of nursing home fall prevention. For a 500-resident community it estimates:
| Scenario | Falls | Injuries | Cost exposure |
| Current state | 125 | 12.5 | $781,513 |
| With 22% reduction | 97.5 | 9.75 | $609,580 |
| Difference | 27.5 | 2.75 | $171,933 |
One caveat: the $62,521 figure comes from a study of the Fall TIPS program at two U.S. health care systems, which measured hospital costs. A senior living community’s cost per injurious fall may differ, so substitute your own numbers where you can.
Scorecard
| Area | What to track | Review |
| Response | Alarm-to-arrival average and 90th percentile, by shift | Monthly |
| Detection | Share of falls detected automatically; false-alarm rate | Monthly |
| Outcomes | Falls and injurious falls per 1,000 resident days, repeat fallers | Quarterly |
| Documentation | System alerts vs incident reports, post-fall review completion | Monthly |
| Adoption | Device-in-use rate, training completion, staff feedback | Quarterly |
| Financial | Injury costs and program cost vs baseline | Annually |
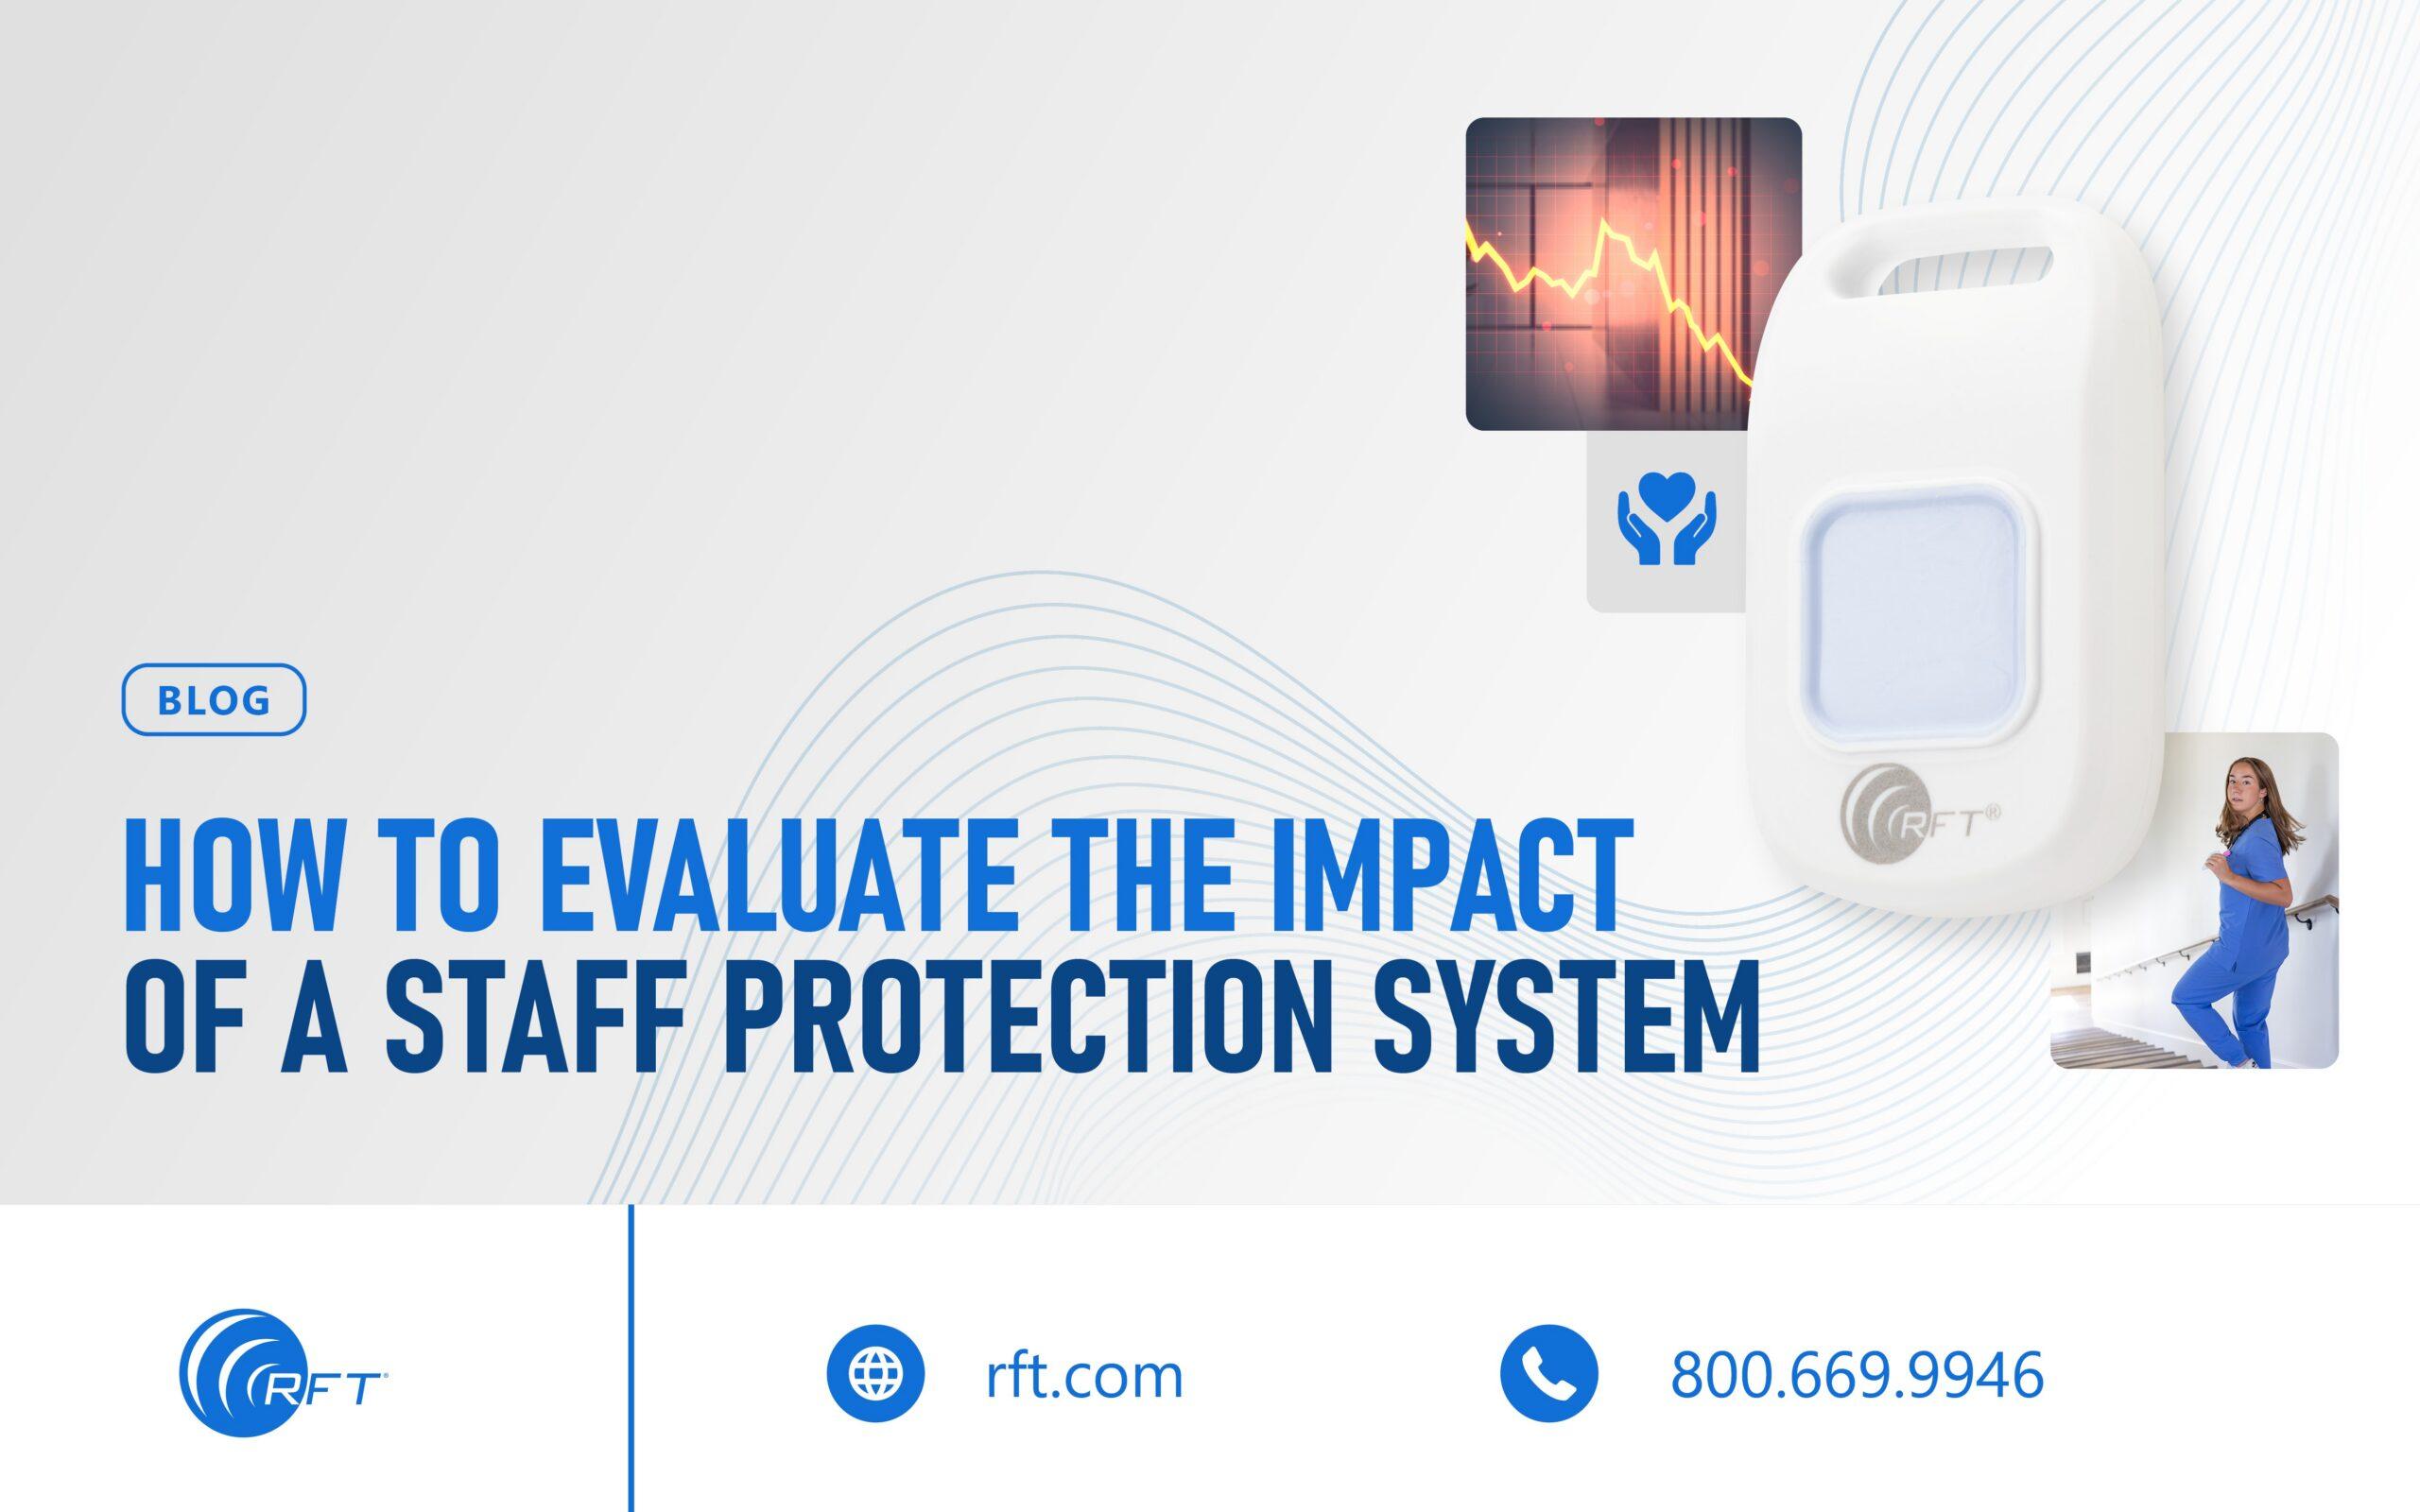
To model your own numbers, RFT offers a Fall Injury Cost Exposure calculator. The same approach works for evaluating a staff protection system.
Reference List: